.............................
MORGANE home page
...............................
Access to the maps
...............................
Access to the Reunion data
.............................
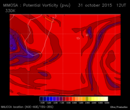
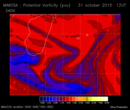
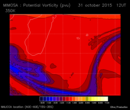
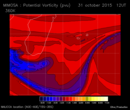
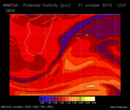
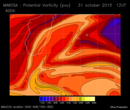
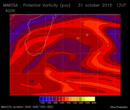
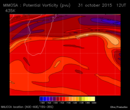
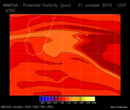
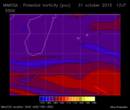
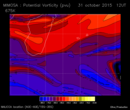
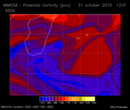
Potential Vorticity data analysis from MIMOSA Model for MORGANE campaign
Select a year, a month and a day to access to the relevant potential vorticity analysis maps.| PV à 330K | PV à 340K | PV à 350K | PV à 360K | PV à 380K | PV à 400K |
| 
| 
| 
| 
|  |
| PV à 420K | PV à 435K | PV à 475K | PV à 550K | PV à 675K | PV à 950K |
| 
| 
| 
| 
|  |